Using AWS Native Cost Intelligent Tools to manage your cloud spend enable you to build data-rich experience for your organization, and also it helps you drive cost efficiency with your operational and engineering team.
Cloud financial management is so important these days, you can’t afford to ignore it, global cloud spend right now, is approximately $500 billions, most of the enterprises waste about 32% of their cloud spend and 67% of the enterprises agreed that cloud financial management help revenue grows.
Cloud Financial Management (CFM) help you differentiate between a good spend from a bad spend, it helps you eliminate idle resources, underutilize resource helps you spot architectural inefficiency that are wasting your resources.
It also allows you to align your unit cost to the marginal cost of your business, even if your spending is going up and your unit cost is moving downward, that’s still a good sign you’re heading in the right direction.
When it comes to cost analysis and optimization tools in AWS there are so many tools that are native to AWS, tools like Cost Explorer, Cost and Usage Report, AWS Budget, Trusted advisor, Cost Anomaly Detection, AWS Cost Allocation Tags, AWS Cost Category just to mention a few.
The ability to combine and use them effectively to get the desired result is challenging, for example, I wrote a detailed article about most of them, combining them to get the job done is a pain in the ass, but with the introduction of the AWS cloud intelligent dashboard, managing your cloud spend in one place is now a stroll in the park.
The solution to making use of all these tools in one spot and being able to determine your unit cost, set KPIs and measure your cost optimization effort for your organization is the cloud intelligent dashboards, yes you heard me right, cloud intelligent dashboard.
The cloud intelligent dashboards contain six dashboards, i.e The trusted adviser organizational dashboard (TAO) , Compute Optimizer Dashboard, CUDOS Dashboard, KPI Dashboard, Trend Dashboard and Cost Intelligent Dashboard.
These six dashboards will enable you to report to various stakeholders in your organization, as a FinOps practitioner you will be able to bring the various persona like the executive, finance and procurement, business owners, engineering and operation teams together to make informed decision base on relevant data that will drive cost lower, and meet business goals and objectives.
With the Trend and cost intelligent dashboards, you can give a comprehensive high-level summary to the executive, with the CUDOS and cost intelligent dashboard your finance and procurement department can have a view of their spend, with the KPI and the CUDOS dashboard the business/product owners will have something to make informed decisions. While the FinOps practitioners, engineering and the operations team will find the KPI, Compute Optimizer, trusted adviser, CUDOS dashboards useful for resources that are under-provision, over-provision and need to be right-sized.
Let me give you a brief description of six dashboards and what they can do for you and your organization.
- The trusted adviser organizational dashboard (TAO)
The TAO dashboard provides you a comprehensive detail and trends across your entire Organization. is a set of visualization tool that gives a lot of benefits that allow you to quickly locate accounts and users that haven’t rotated their AWS IAM keys, it helps you Identify idle and underutilized resources by cost or account and also helps you see a list of accounts that have reached over 80% of individual service limit
- Compute Optimizer Dashboard
AWS Compute Optimizer is a service provided by Amazon Web Services (AWS) that helps optimize the performance and cost-effectiveness of your EC2 instances and Auto Scaling groups. The Compute Optimizer Dashboard is a feature within the AWS Management Console that provides a consolidated view of recommendations and insights to improve the utilization and efficiency of your compute resources.
The dashboard displays resource utilization metrics for your EC2 instances, including CPU, memory, and EBS (Elastic Block Store) volume utilization. This helps you identify underutilized or overutilized instances and make informed decisions to right-size your resources.
- CUDOS Dashboard
The CUDOS Dashboard is one of six dashboards that make up the AWS Cloud Intelligence Dashboards framework. CUDOS Dashboard provides the most comprehensive cost and usage details, with resource level granularity to help you optimize cost, track your usage goals, and achieve operational excellence.
It uses the built-in tag explorer to group and filter cost and usage by your tags.and helps you view resource-level detail such as your hourly AWS Lambda or individual Amazon S3 bucket costs and helps you get alerted to service-level areas of focus such as top 3 On-Demand database instances by cost.
- KPI Dashboard
The AWS KPI (Key Performance Indicator) Dashboard is a tool provided by Amazon Web Services (AWS) that allows users to monitor and track key metrics and performance indicators related to their AWS resources and services. It provides a centralized view of critical data and metrics, enabling users to gain insights into the health, performance, and utilization of their AWS infrastructure.
Overall, the AWS KPI Dashboard is a powerful tool that helps users monitor, analyze, and optimize their AWS infrastructure by providing a centralized view of key metrics and performance indicators. It supports customization, real-time monitoring, visualization, alarms, historical data analysis, and integration with other AWS services, empowering users to make data-driven decisions and ensure the efficient operation of their AWS resources.
- Trend Dashboard
The AWS Trend Dashboard is a tool or feature that allows users to track and visualize trends in various metrics and performance indicators related to their AWS resources and services over time. It provides insights into historical data and helps users understand patterns, identify changes, and make informed decisions based on long-term trends.
Granularity and Aggregation: The Trend Dashboard provides options for granularity and aggregation of data. Users can choose the level of detail they want to view, such as data points per minute, per hour, or per day. They can also aggregate data to calculate averages, sums, maximums, minimums, or other statistical values.
The AWS Trend Dashboard empowers users to gain historical insights into the performance, utilization, and behavior of their AWS resources. By visualizing trends, detecting anomalies, and analyzing correlations, users can optimize their infrastructure, make data-driven decisions, and ensure the efficient operation of their AWS services.
- Cost Intelligent Dashboard.
The Cost Intelligence Dashboard is your real FinOps tool for reporting to directors, Executives and any other persons who manage the cloud financials for an organization, is a customizable and accessible dashboard that helps you create the foundation of your own cost management and optimization.
The CID helps you create showback and chargeback reports for internal business units, accounts, or cost centers.
It helps you track how Savings Plans (SP), Reserved Instances (RI), and Spot Instance usage has impacted your unit metrics such as your average hourly cost of Amazon EC2.
It helps you keep track of which accounts or internal business units receive savings and when RIs and SPs expire.
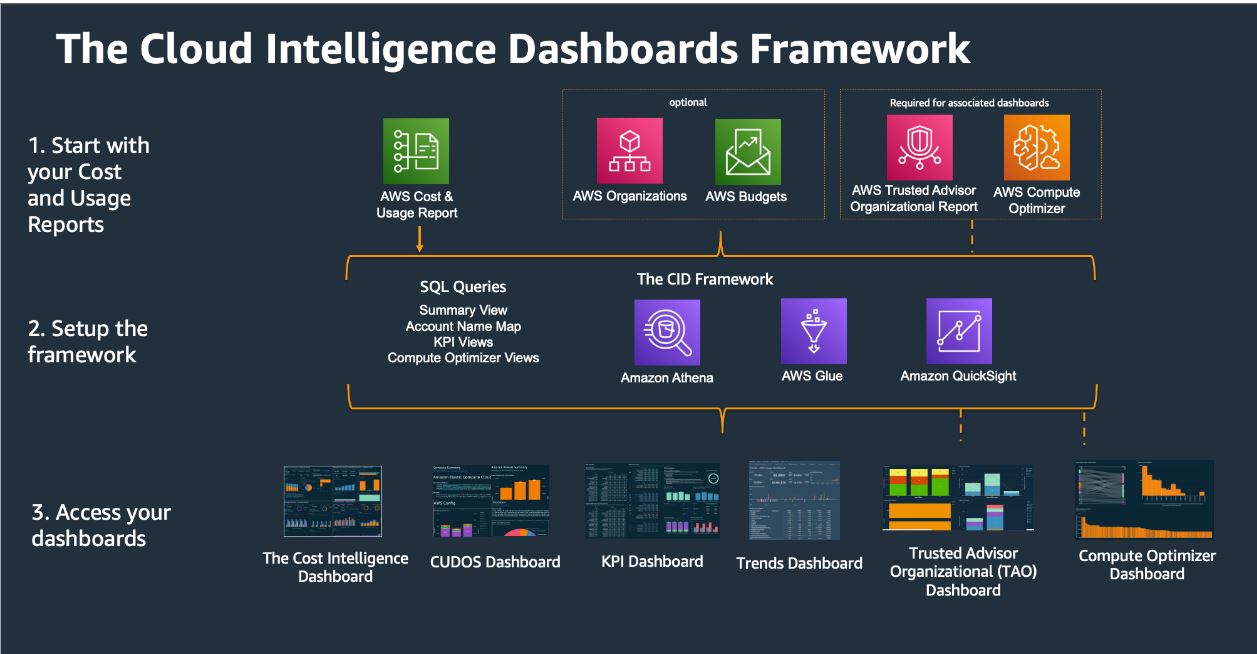
The Cloud Intelligent Dashboard framework
The CID collects information from all the AWS native tools for cost management like the cost and usage report, the most comprehensive source of your billing data, the AWS organization which is the metadata of your accounts, AWS budget, which allows you to set and manage budget, AWS compute optimizer which helps you to manage your compute capacity efficiently and AWS trusted advisor and gives you recommendation to manage your cost efficiently.
The CID framework which consists of AWS Glue helps you with your ETL services, Athena helps you with query and analysis of your data and Quick Sight which is the backbone of the CID help you build data-rich experience fast with a unified BI for your analytics need and Consistent high performance at scale to power the cloud intelligent dashboards.
Like the saying goes, you can only effectively manage things you can measure, as a you can only effectively drive change in a large organization if you’re able to contextualize what you’re measuring and share the insight with individual and teams who are inspired to take action.